The post TUI soars above cloud complexity with Dynatrace appeared first on Dynatrace blog.
↧
TUI soars above cloud complexity with Dynatrace
↧
Fearless from Monolith to Serverless with Dynatrace
After years of “Breaking the Monolith into Microservices” talk, many organizations are at a point where they have either implemented new projects based on a micro-service architecture or have added new features using micro-services and connected them with the backend monolith. Some found ways to “strangle” out services from the monolith, as proposed by Martin Fowler, followed Sam Newman’s Microservice principles or Adrian Cockcroft’s work on State of Art Microservices.
While many organizations are still in that transformation step, the next big thing is looming: Breaking your Services into Functions and running them on “Serverless” platforms such as AWS Lambda, Azure Functions, Google Cloud Functions or Pivotal Function Service.
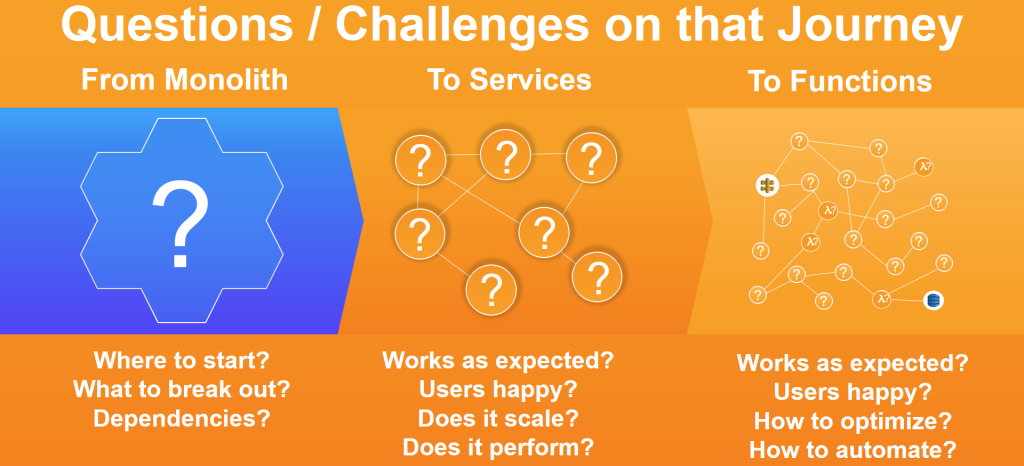
Whether you are already on the leading edge with Serverless or are still wrapping your head around how to componentize your monolith – there are and will be challenges in that transformation.
I took the liberty and re-purposed (borrowed, stole…) some slides from an AWS presentation I saw at our Dynatrace PERFORM 2018 conference delivered by Tomasz Stachlewski, AWS Senor Solutions Architect. He found a great way to visualize the transformation from Monolith via Services to Functions. I added questions in each of his transformation phases that I keep hearing from companies that are struggling to move along that trajectory:
What we learned in our Dynatrace Monolith transformation!
At Dynatrace, we had to ask ourselves the same questions when transforming our monolithic AppMon offering towards our new Dynatrace SaaS & Managed solution. Not only did we transform our culture and approach, we also had to transform our architecture. We ended up with a mix of pretty much everything, such as different tech stacks and 3rd party services to solve individual use cases in an optimal way. Overall, we saw a clear move towards smaller independent components, services, APIs and functions that fulfill different purposes. The success can be seen when looking at some of the metrics we have shown at recent DevOps & Transformation events:
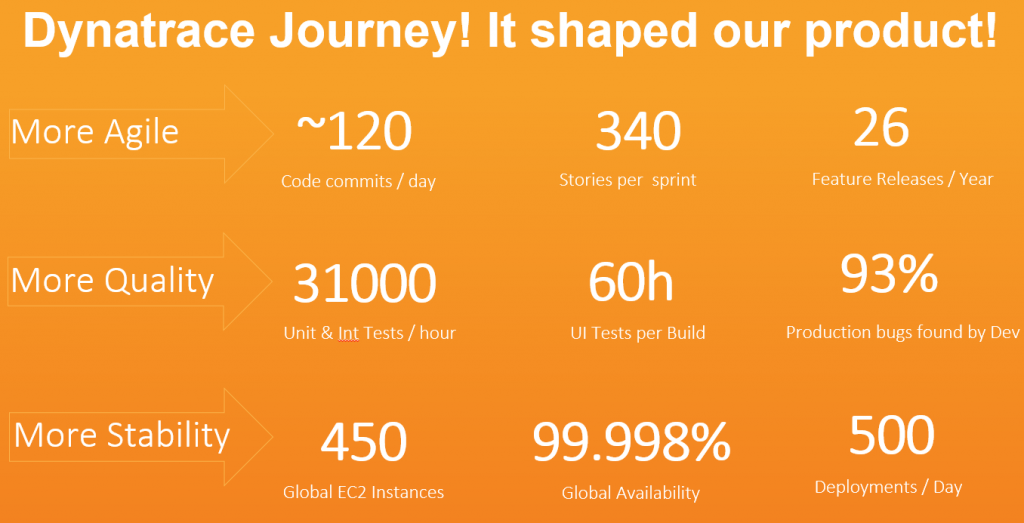
As part of our transformation, we forced ourselves to leverage and shape Dynatrace as much as possible. This resulted in a lot of the features you now see in the product such as:
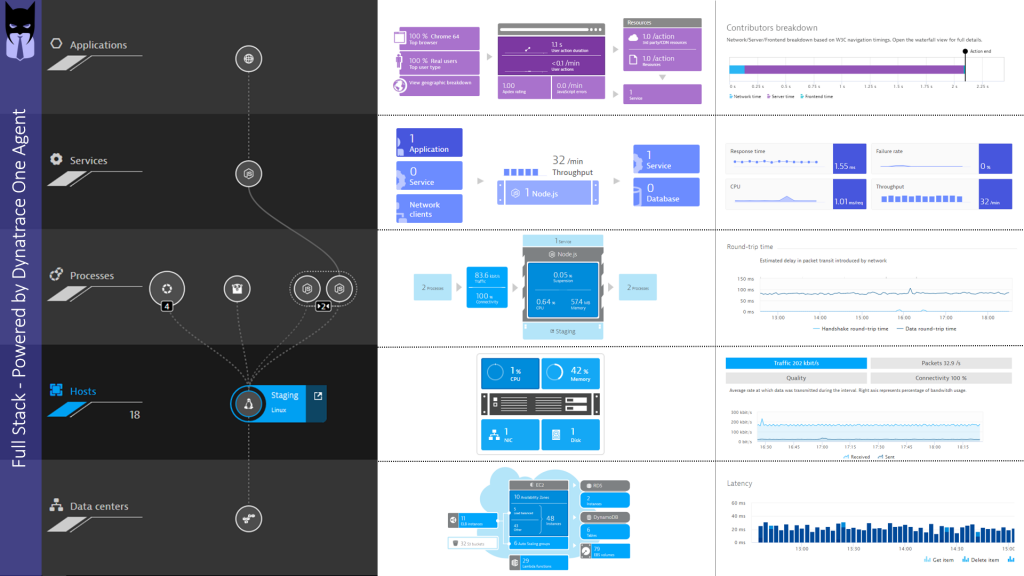
- OneAgent: A single agent that covers the full stack instead of individual agents
- SmartScape: Automated Dependency Detection to better understand what is really going on
- AI: Automated Baselining, Anomaly and Root Cause Detection. Because your teams can’t keep up with the complexity in the old way we did monitoring
- API-First: Everything must be doable via an API to integrate Dynatrace into our pipelines
11 Use Cases you must MASTER in your Transformation!
When we look back at the transformation path laid out by Tomasz, then we believe that we can answer all the questions and allows you to accelerate that transformation, without fearing that something will go completely wrong:
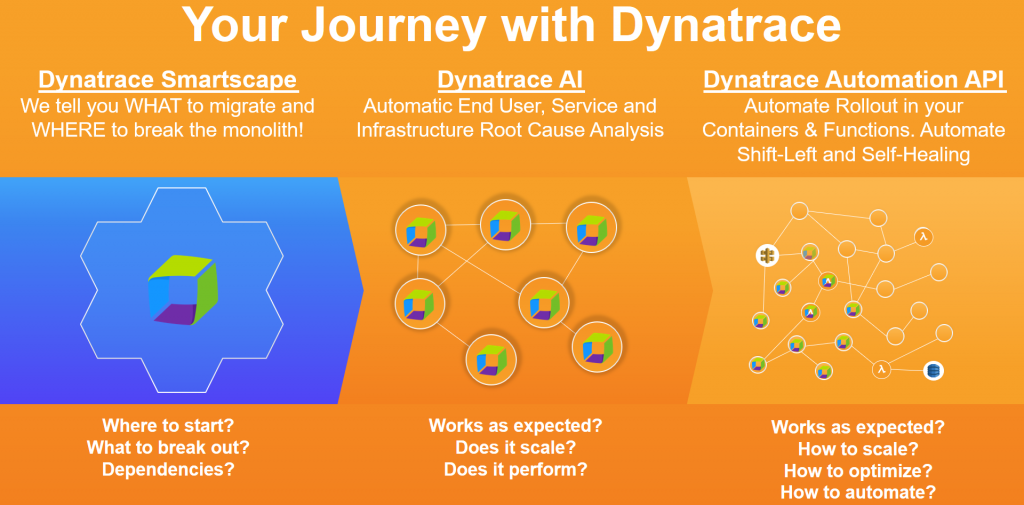
Let me briefly dig deeper into the individual phases of your transformation and how Dynatrace supports you:
#1: What are we migrating? What are my dependencies?
When we started our transformation, we assumed we knew everything about our status-quo, until we saw the real status-quo and knew that we were far off. To make it easier for us – and therefore also for you – to get a better understanding of the status-quo we invested a lot into Dynatrace OneAgent and Smartscape. Simply, drop the OneAgent and it tells you which services are running on which hosts and what other services, processes and hosts they are the depending on. With this information – also accessible via the Dynatrace API – you can make better decisions on which components to migrate and which ones to leave alone (at least for now):
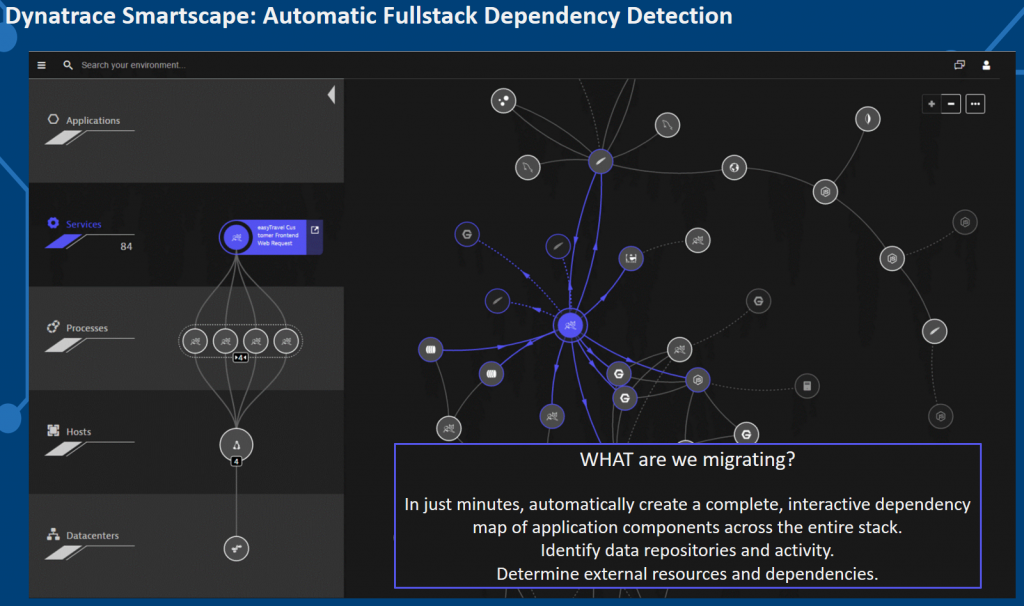
Tip: Smartscape shows you all dependencies based on where services run (vertical dependencies) and whom they talk to (horizontal dependencies). Before picking your monoliths or applications to migrate or break into smaller pieces, make sure you first understand the real dependencies. You might find unknown dependencies to a database, a background process, a message queue or an external service that is only accessible in that environment. Leverage the Smartscape API to automate some of these validation steps.
#2: Where to break the monolith?
A common approach to break the monolith, is by refactoring the monolithic codebase into individual modules or components, designing well-documented interfaces and hosting them in containers. This works well if you know the codebase and understand which part of your code is calling which other parts of your code, so that you can make better decisions on how to refactor and extract. This often leads to many trial & error attempts, as well as lots of iterations of refactoring.
While Dynatrace doesn’t solve the problem of refactoring and extracting your components into services, we built a cool feature into Dynatrace that allows you to “virtually” break the monolith into services and let Dynatrace tell you how your current monolith would look like in case you extract code along these “seams” (methods or interfaces). The feature is called “Custom Service Entry Points,” which allows you to define those methods that will become your new “service interfaces”.
Once you define these entry point rules, Dynatrace will visualize end-to-end Service Flows, not by drawing a single monolithic but by showing each service interface as an actual “virtual” services. The following animation shows what this mentioned ServiceFlow looks like. Instead of a single monolith you see it “broken into services”. All of this without having to make any code changes.
Tip: The ServiceFlow gives you a lot of powerful insights into how these services are interacting with each other. You can identify services that are tightly coupled or send a lot of data back and forth. These are all good indicators that you might not want to break it along those lines. If you want to automate that analysis you can also query the Smartscape API as it provides “relationship” information between services and processes. This avoids somebody having to manually validate this data through the WebUI.
#3: Did we break it successfully?
After extracting your components into services and running them standalone or in containers, Dynatrace OneAgent and Smartscape can help us validate whether the new architecture and deployment really turned out as expected, like where do these services run? How many are there? How are they distributed across data centers, regions or availability zones? Are they running the same bits and provide the same service endpoints?
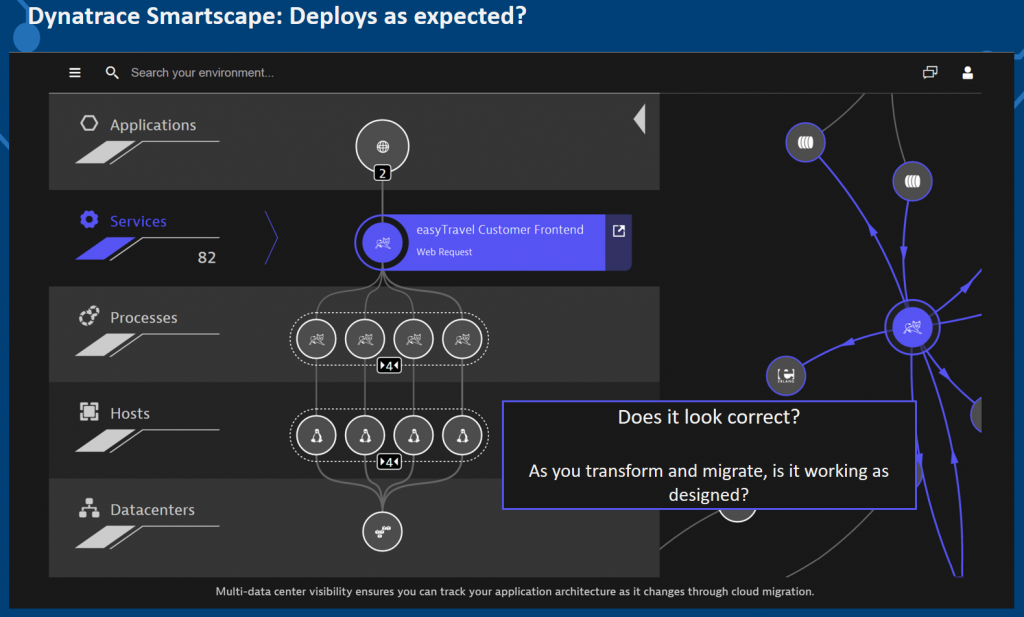
Tip: Like my previous tip, use the Smartscape API to automate validation, as all this data you see in the Smartscape view can be accessed via the API. This allows you to automatically validate how many service instances are really running, where they run and what the dependencies are. It’s a great way to flag dependencies that shouldn’t be there as well!
#4: Does it PERFORM as expected?
When migrating from one system to another, or from one architecture to another, we want to make sure that key quality aspects don’t deteriorate. Performance, stability and resource consumption are some of these key quality attributes. With Dynatrace, we can compare two timeframes with each other to validate if metrics such as Response Time, Failure Rate or CPU consumption have changed:
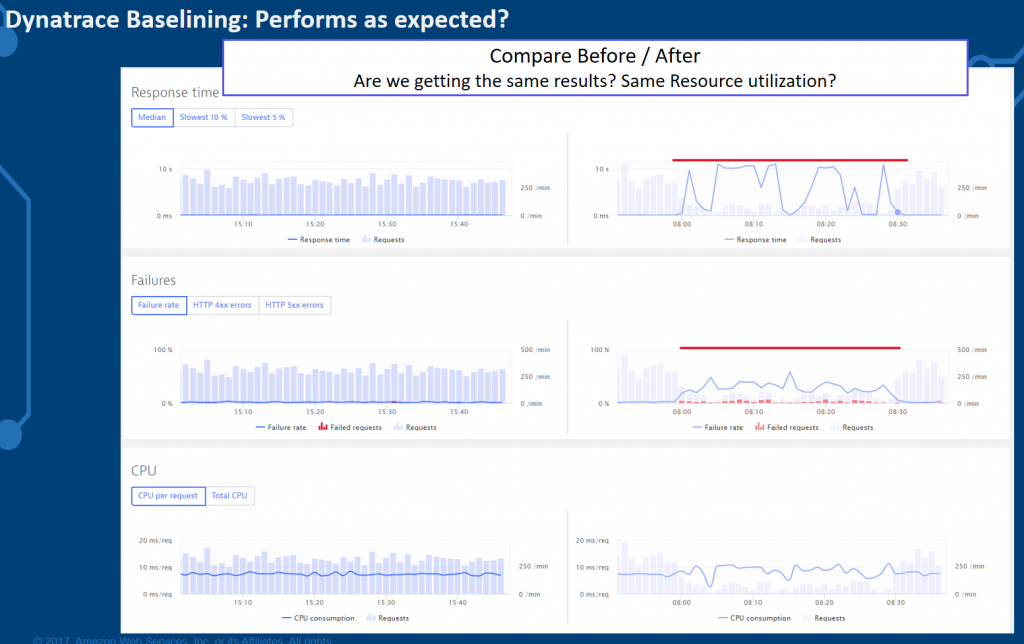
Tip: The Dynatrace Timeseries API allows you to pull all these – and even more metrics – automatically from Dynatrace for any type of entity and timeframe. This allows you to automate the comparison. Check out my work on the “Unbreakable Delivery Pipeline” where I implemented this automatic comparison between builds that get pushed through a CI/CD DevOps Pipeline.
#5: Does it SCALE as expected?
One of the reasons we break a monolith into smaller pieces, is to enable dynamic scaling of individual components/services depending on load or to ensure a certain level of service. With Dynatrace, we observe how your architecture scales under load and when we reach scalability limits. The following screenshot shows that we can look at Smartscape for different load scenarios, e.g: during an increase load performance test scenario. We can see how many services are running for each load, we can validate load balancing and we can also observe when service instances start to fail. This is very valuable insights for your architects but also your capacity planning teams:
Tip: Especially for performance and capacity engineers I suggest looking into the Smartscape and Timeseries API. While you run your tests, there is no need to stare at our dashboards (well – you can if you want to). But I suggest using our API and extract the data you need for your Capacity Assessments.
#6: Does it INTERACT as expected?
After extracting the monolith into smaller pieces, we should have a clear picture in our mind on how the end-to-end transaction flow looks like. At least on paper! But what is the reality? Which service calls are really involved in end-to-end transaction execution? Do we have an optimized service execution chain or did we introduce any bad architectural patterns such as N+1 Service or Database calls, missing caching layer, recursive calls …? Simply look at the ServiceFlow and compare what you had in mind with what is really happening:
Tip: The ServiceFlow provides powerful filtering options allowing you to focus on certain types of transactions or transactions that have a certain behavior, e.g: transactions that flow through a certain service, that use a certain HTTP Request Method (GET, POST, PUT, …) or those that show bad response time. For more details check out the blogs from Michael Kopp on Extended Filtering, Problem and Throughput Analysis and Enhanced Service Flow Filtering.
#7: Does user BEHAVIOR change as expected?
Bottom line with any transformation is that our end users should not experience any negative impact on using our services. That’s why it is important to monitor your end users, their behavior and how that behavior changes once moving over to the new architecture.
We should NOT expect any negative impact – in fact – we should at least expect the SAME or BETTER behavior, e.g: more user interaction, increased conversation rates, etc. With Dynatrace, we simply look at RUM (Real User Monitoring) data where we automatically track key user behavior metrics:
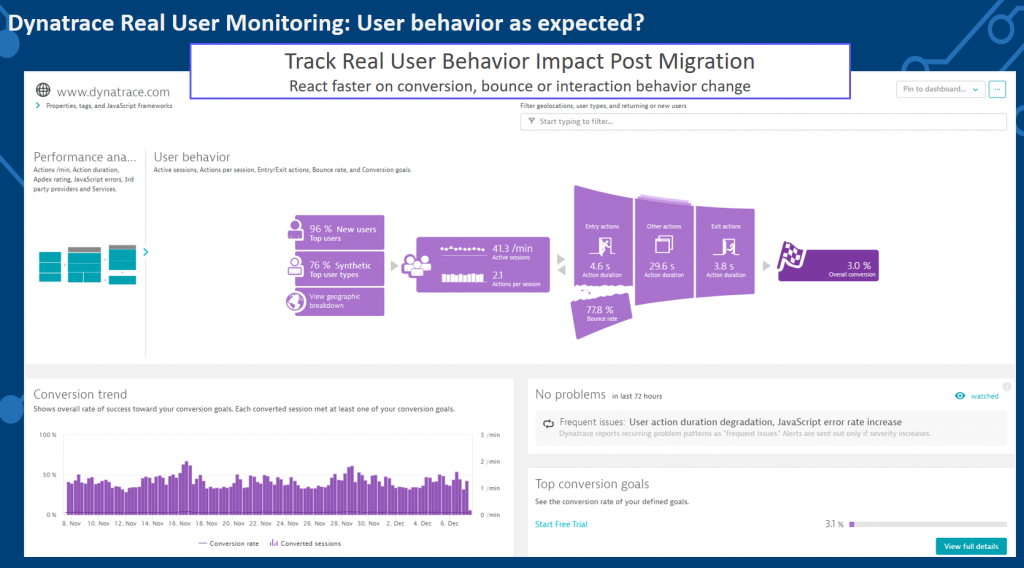
Tip: There are many great real user monitoring metrics we can look at, analyze and start optimizing. If you want to learn more about how to use Dynatrace RUM to optimize your user behavior check out the Performance Clinic with David Jones on Unlock your Users Digital Experience with Dynatrace. Oh yeah – did I mention we have an API for that as well? You can query application level metrics through the Timeseries API and automate these validation checks!
#8: How to manage and control cloud and cloud service usage?
It’s great to move applications and services to the cloud and leverage existing cloud services instead of building it yourself. But without knowing what your code is really doing and which of your applications and services are using which cloud services you got to pay for, e.g: DynamoDB, EC2, … you might be surprised at the end of the month when you get your cloud providers usage bill.
Dynatrace integrates with all major cloud provides and gives you insights on WHERE your custom code runs and WHICH paid cloud services are consumed in which extend. You can even break this down to individual features and service endpoints.
This allows you to allocate cloud costs to your applications and services and gives you a good starting point to optimize excessive or bad usage of cloud resources which will drive costs down.
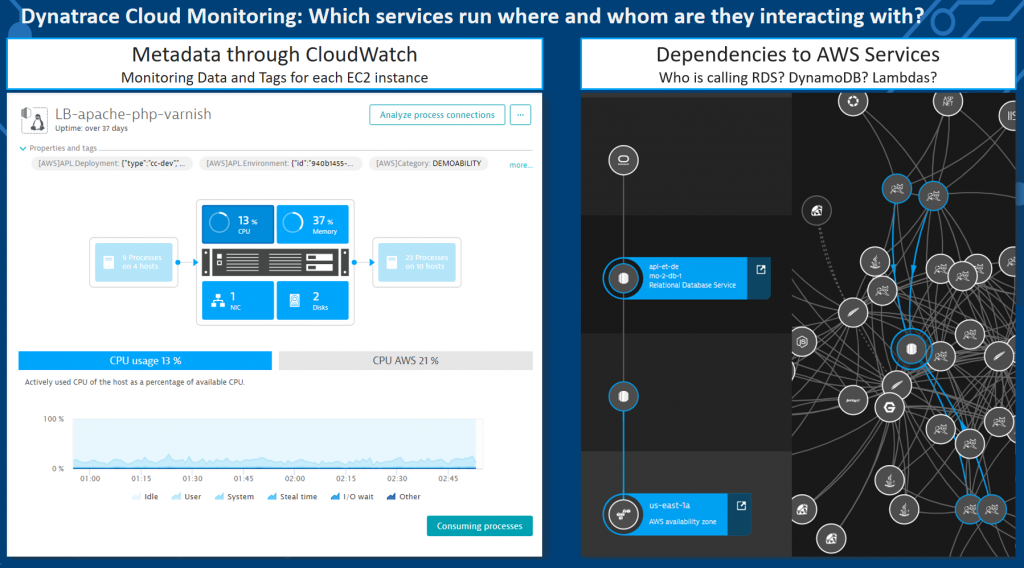
Tip: Dynatrace automatically pulls meta data information from the underlying virtualization, cloud, container and PaaS environment. This meta data can be converted into tags which make it easy for you to analyze and organize your monitoring data. To learn more about proper tagging check out Mike Gibbons 101 Tagging with Dynatrace performance. And as mentioned many times before: leverage the Dynatrace API to extract this information to automate auditing and controlling of your cloud usage.
#9: How to manage logs in a cloud environment?
With all the automatic instrumentation and tracing that monitoring tools provide we still rely on logs. There are many great log analytics tools out there but not all of them are built for the challenges of the cloud, which is: you do not always know which log files are written, where they are stored and how long are they available? Think about containers – that might be short lived – and so are the logs: you don’t want to implement custom log capturing strategies depending on the container technology, cloud or PaaS provider.
Dynatrace OneAgent automatically takes care of that. Once installed, OneAgent automatically analysis all log messages written by your code, by 3rd party apps and processes and by the cloud services that they rely on. Everything accessible in the Dynatrace Web UI!
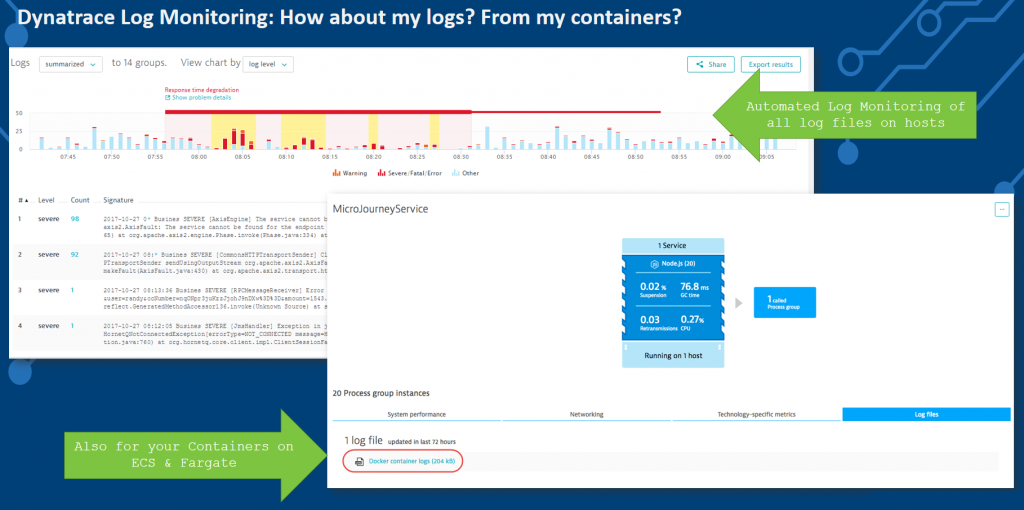
Tip: Dynatrace automatically detects bad log entries and feeds these to the Dynatrace AI for automatic problem and root cause analysis. Make sure to check out some of the advanced options such as defining your custom log entry rules as well as our recently announced updates such as centralized log storage.
#10: How to manage containers?
You eventually end up using some flavor of containers in your deployments. Whether it is Docker, rkt, Kubernetes (k8s), OpenShift, ECS, Fargate, EKS … Whatever flavor you end up choosing, you will want to know how many of these containers are actually running at any point in time, which services they support and what to do in case something is not working as expected.
Dynatrace provides full container visibility thanks to OneAgent. Not only do we monitor your containers, but we also extract meta data from these containers that make it easier to know what runs in that container, to which project it belongs and whom to contact in case something goes wrong:
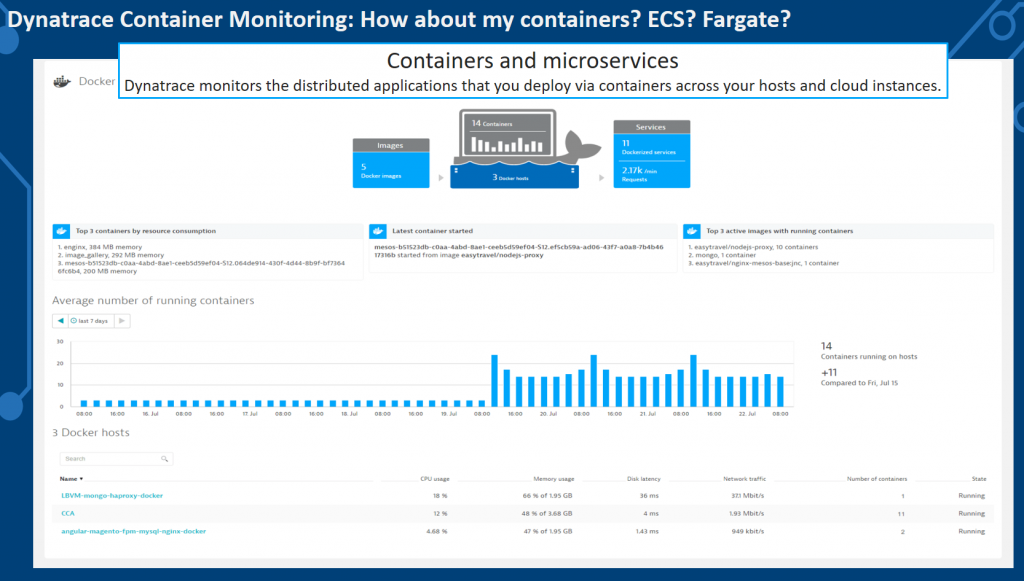
Tip: Take a closer look at the different OneAgent deployment options we provide for containers. Whether it is installing the OneAgent on the Docker host, whether running the OneAgent as an OpenShift DaemonSet or whether installing it into the container itself. You will always get the visibility you need! For information on k8s, Mesos, GKE, Fargate, ECS make sure to check the latest documentation on container monitoring.
#11: What are my Serverless Functions doing?
Once you start leveraging serverless you want to know what your AWS Lambda, Azure Functions, Google Cloud Functions or Pivotal Function Service are really doing when being executed. You will be charged by the number of execution and total execution time, so you better understand whether you have a performance bottleneck in one of these functions or whether your functions are accessed too often in a wrong way, e.g: N+1 Function Call Pattern, Recursive Calls, Missing Result Caches, …
Dynatrace provides end-to-end visibility for AWS Lambda and Azure Functions and is actively working on providing end-to-end code-level visibility for other upcoming Function as a Service (Serverless) providers:
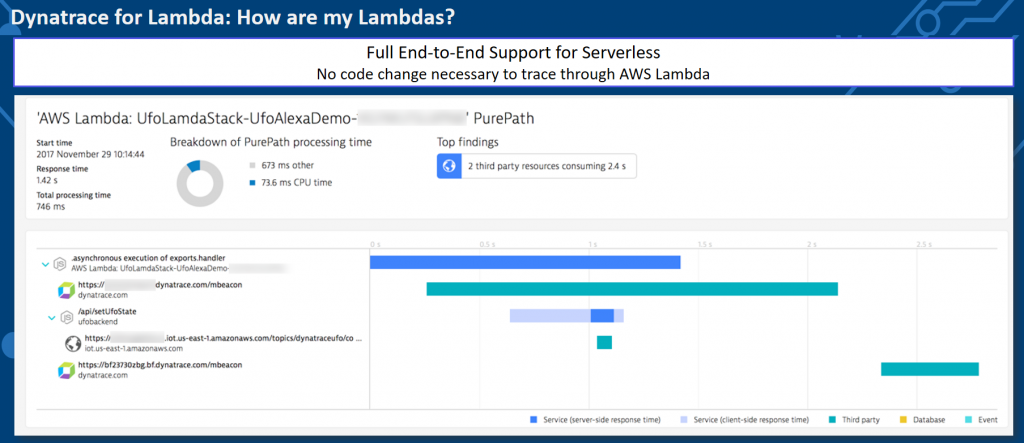
Tip: I’ve done some AWS Lambda development in the past. While the built-in debugging, logging and monitoring support slowly improves, it is still very hard to do proper large-scale monitoring and diagnostics. You must invest a lot of time into writing proper logs. With Dynatrace this all goes away as all the data you need is collected and provided through our various analytics views. If you want to learn more make sure to check out the latest Dynatrace blogs around serverless.
You will fail, eventually. We help you recover fast!
Along this journey you will end up with problems – despite following my steps. It is natural as we are not dealing with a simple problem. We also fail – on a continuous basis. But we continuously recover and we are doing this faster with every time we fail and we are automating as much as possible.
This process shaped our Dynatrace AI, the automatic anomaly and root cause detection which not only reduces MTTR if you are manually analyzing the AI-provided data. It also allows you to implement smart auto-remediation and self-healing. The following animation shows the rich-ness of data, the context and the dependency information Dynatrace provides as part of an automatic detected problem. What you are seeing here is what we call the Problem Evaluation, I call it the “Time Lapse View of a Problem”. This makes it much easier understanding where the problem is, how it trickles through your system and where your architectural or deployment mistake lies.
Tip: Check out my recent blog posts on real-life problems detected by the Dynatrace AI and my thoughts on how to automate the remediation of these problems. All the automation is possible through our Problem REST API.
Finally: Accelerate through Continuous Delivery
If you have followed my work, you know I am a big fan of Contiguous Integration & Continuous Delivery. I also have my thoughts on Shift-Left, Shift-Right and Self-Healing.
Whatever you do in your transformation make sure to read through my tips and start automating as many of these “quality gate checks” into your delivery pipeline. The Dynatrace REST API enables you to do this type of automation and thanks to the flexibility of state-of-the-art CI/CD tools we can integrate Dynatrace into your pipeline.
If you have questions feel free to reach out to me. Leave a comment here and tweet at me. Happy to give guidance in your transformation based on our own experience and experiences that others have shared with me!
The post Fearless from Monolith to Serverless with Dynatrace appeared first on Dynatrace blog.
↧
↧
Everything as Code
We’re no longer living in an age where large companies require only physical servers, with similar and rarely changing configurations, that could be manually maintained in a single Datacenter.
We’re currently in a technological era where we have a large variety of computing endpoints at our disposal like containers, Platform as a Service (PaaS), serverless, virtual machines, APIs, etc. with more being added continually. And with today’s increasing financial, availability, performance and innovation requirements meaning applications need to be geographically dispersed to constantly changing dynamic powerhouses, it has become simply not possible to provision, update, monitor and decommissions them by only leveraging manual processes.
And, this is even more apparent due to the ever-increasing infrastructure complexity enterprises are dealing with.
At Dynatrace we believe that monitoring and performance should both be automated processes that can be treated as code without the need for any manual intervention. And, applying the “Everything as Code” principles can greatly help achieve that.
The current state of tools
Everything as Code can be described as a methodology or practice which consists of extending the idea of how applications are treated as code and applying these concepts to all other IT components like operating systems, network configurations, and pipelines.
It’s important to note that the “Everything as Code” methodology covers a wide variety of tools, many of which are open source, including Infrastructure as Code, configuration management, operations, security and policies, which can each be leveraged for transforming to Everything as Code. Treating these different processes as code will ensure that best practices are followed. Some of the most popular tools, as listed, can be broken down into the following categories:

Each of these tools are there for us to embrace and transition to Everything as Code. But to reach this, a cross-team cultural mind-shift is imperative.
Once the respective teams are on board and ready to follow these principles, the operations processes can be taken to the next level of efficiency. This will allow teams to start worrying about other things that have not been solved yet by the extensive tools already available.
Benefits of Everything as Code
Using Everything as Code principles have an extensive amount of benefits, including:
- Knowledge and clear understanding of the environment: Have complete insight into your infrastructure, configurations, and policies without the need to rely on manually updated documents or network diagrams.
- Automated Monitoring: Applying the Everything as Code methodology to monitoring will result in the ability to automatically deploy and update components like the OneAgent and ActiveGate without the need for any manual intervention.
- On-demand infrastructure: The ability to deploy infrastructure whenever it’s required. This infrastructure can be integrated into a DevOps pipeline to dynamically build and destroy environments as the pipeline executes.
- GitOps: This model provides a bridge for development and production where Git is the source of truth all code can be analyzed for potential errors (linting), compared, tested and validated, giving teams more visibility, higher collaboration, and an overall better experience. Since code is now version controlled, rollbacks should be easy to apply.
- Consistency: Migrations, deployments and configuration changes should be simple and easy to replicate. Setting up deployment on a specific cloud provider or an environment will result in the same configuration as if the same deployment was targeted towards a different cloud provider or another environment.
“Everything as Code” methodology in Dynatrace
At Dynatrace we embrace Everything as Code, starting with our own culture and processes, in which we use a wide variety of tools that allow teams to keep as much as possible codified. We went from managing five EC2 instances in 2011 to around 1,000 in 2017. It was clear that in order to be successful in a changing digital world we needed to transition to using code for our operations instead of just doing it manually.
These tools and principles helped us build our SaaS solution in the Amazon Web Services (AWS) cloud. Now, we believe that operations should be as automated as possible and this has led to significantly lower downtime and our teams can put more focus creating fires that we can prepare for, instead of putting them out after they happen.
Many of our principles are based on Autonomous Cloud Management (ACM) which is a methodology built around Everything as Code. It focuses on transforming from DevOps to NoOps, as well as automation and leveraging code for automated deployments and configuration management of the OneAgent, ActiveGate, and Managed Clusters. But we don’t just stop at automated monitoring – we also offer the tools to codify automated performance quality gates into your pipelines using Keptn Pitometer.

At Dynatrace, we understand how critical monitoring can be and how changes in its configuration can cause significant problems, especially in production environments. We wanted to take this a step further and apply the Everything as Code methodology to monitoring configurations as well. For this reason, we’ve developed the Configuration API which allows Dynatrace users to manage their monitoring setup using the Dynatrace API.
Interested in next steps?
There are a range of AI Ops next-generation technologies that will start becoming more popular and help manage operations, monitoring and security more efficiently and in an even more automated fashion. Our AI engine, Davis, makes Dynatrace a successful next-generation technology and is enhanced with advanced root-cause analysis capabilities and automated dependency detection.
And, shifting to the Everything as Code methodology sooner rather than later will help your organization prepare for these newer technologies. Welcoming these principles will not only bring an extensive amount of benefits to your organization, but it will allow you to stay up to date with the industry, and most importantly provide a better experience to both your employees and customers.
If you’d like to learn more about how we apply the Everything as Code principle, you can check out our Autonomous Cloud Lab (ACL) in which we cover the different ACM building blocks that explain how you can use and apply many of the principles that Everything as Code offers and help your organization through the journey of Digital Transformation.
The post Everything as Code appeared first on Dynatrace blog.
↧
Automation is a must-have for monitoring complex environments
As you know, applications are becoming exponentially more complex and dynamic thanks to cloud, containers and microservices. This has some serious implications for those responsible for ensuring application performance and availability:
- Humans can no longer comprehend the entire application from end to end, so you need AI-powered answers.
- It becomes too difficult to stitch together data from disconnected point solutions, so you need a full stack solution that sees everything in context.
- The manual effort to deploy, manage and get value from your traditional monitoring solution is no longer feasible. You need automation every step of the way.
Massive automation is at the heart of the Dynatrace platform and powers every aspect of our monitoring and analytics. Let’s see how.
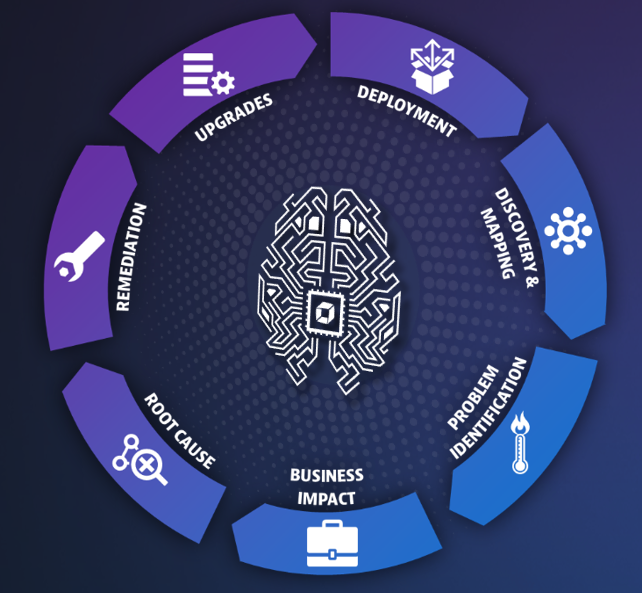
Deployment, discovery and dependency mapping
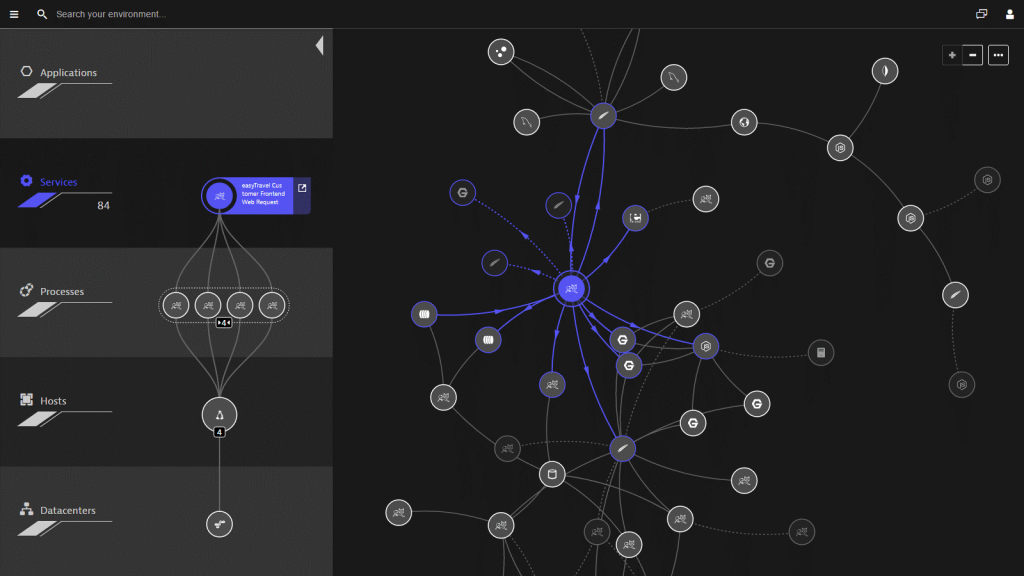
With traditional monitoring tools, to fully instrument your application you must understand everything about the app. What are all the components and where do they live? With the complexity of modern apps, this is no simple feat. Not only are there dozens of technologies involved in every transaction, but with the advent of microservices architectures, Kubernetes, and containers your app may look different from one minute to the next.
With Dynatrace, the deployment process couldn’t be easier. Simply install OneAgent on your hosts, and that’s it. In minutes, we auto-discover your entire application stack, end-to-end, even those processes running inside containers. Then we create a three-dimensional map of your environment called Smartscape that shows all the relationships and dependencies, both vertically up and down the stack and horizontally between services, processes and hosts. All of this from just installing a single agent!
Contrast that with older, gen 2 solutions like AppDynamics, where you need multiple components depending on which product features you’re using, and multiple agents depending on which technologies you’re running. Not to mention a different setup if you’re running containers, including modification of images to include the appropriate agent, changes to configuration properties, and creating additional standalone containers to run on host machines. And even after all that, you’re only getting part of the picture. It shouldn’t be so hard!
Advanced baselining, problem identification and business impact
Okay, so you have your environment instrumented (either the easy way with Dynatrace or the hard way with another solution). Now, how do you figure out whether you’re having a problem, and how big that problem is?
With other solutions, you’re going to rely on statistical averages, standard deviations, and sampling to determine normal performance, and then you’ll get alerted when something falls outside of those bounds. The problem is, this approach is too simplistic for today’s environments. It leads to false positives, false negatives, and masks underlying issues. Plus, you’ll have no sense of how important an anomaly is, or which anomalies are related. Congratulations, the alert storm you deal with daily has now turned into an alert typhoon.
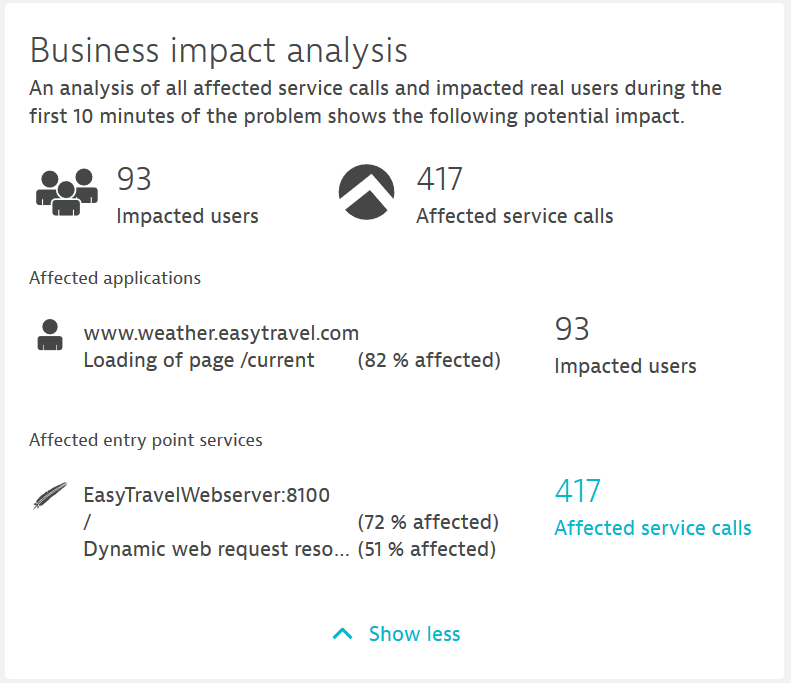
Dynatrace’s approach to detecting problems is much more accurate and useful, and it’s completely automated. We automatically learn what is normal performance and adapt dynamically as your environment changes. Because our AI algorithms understand how everything is related, instead of giving you twenty alerts we give you a single problem. And we automatically show the business impact, so your team can focus on what matters most.
Root cause and remediation
This is all great, but the most important thing is solving the problem, right? Good news – with Dynatrace root cause identification is also fully automated. Because Dynatrace understands all the relationships and dependencies that make up your application, our AI engine can show you with certainty what the root cause of a problem is, and how we found it.
It’s true causation, not correlation like you’ll get with other solutions. Correlation looks at a bunch of disconnected data and tries to make sense of it. It can tell you that a response time slowed down about the same time that a CPU got overloaded, but it can’t tell you whether one caused the other.
Even better than just finding the root cause of a problem, with Dynatrace you can also automate remediation for many issues. When Dynatrace finds a problem, you can have it automatically trigger a remediation task to kick off a job in your continuous delivery tool that can, for example, rollback a deployment to a working state. How cool is that?
Upgrades
Upgrading your APM agents is probably (hopefully!) not the most exciting part of your job. In fact, if you’re using other APM solutions you likely avoid upgrades at all costs, because it means shutting everything down and logging into every host to manually upgrade. And there is never a good time for that. We deploy Dynatrace in environments running outdated AppD agents all the time, because it’s just too painful to keep them up-to-date.
Luckily, we’ve automated this process as well. It’s so easy that you literally need to do nothing. Once you deploy Dynatrace on your hosts, updates just happen. You always have the latest and greatest, no problem.
See for yourself
Seeing is believing. If you’re skeptical about how powerful Dynatrace automation really is, or just curious, it’s easy to try it yourself.
The post Automation is a must-have for monitoring complex environments appeared first on Dynatrace blog.
↧
The need for speed in cloud innovation puts customer experience at risk, say almost three-quarters of retailers
The post The need for speed in cloud innovation puts customer experience at risk, say almost three-quarters of retailers appeared first on Dynatrace blog.
↧
↧
Dynatrace Management Zones released to address multi-cloud software challenges
The post Dynatrace Management Zones released to address multi-cloud software challenges appeared first on Dynatrace blog.
↧
Dynatrace Introduces Management Zones
The post Dynatrace Introduces Management Zones appeared first on Dynatrace blog.
↧
Dynatrace Announces Management Zones to Tackle Dynamic Multi-Cloud Software Challenges
The post Dynatrace Announces Management Zones to Tackle Dynamic Multi-Cloud Software Challenges appeared first on Dynatrace blog.
↧
CIOs see IoT benefits, but fear it will disrupt their IT
Over the last couple of years, IoT has grown from more than just a buzzword to become a fully integrated part of how we live our lives. By 2025, the global worth of IoT is projected to hit $6.2 trillion, demonstrating the sheer scale of potential these connected devices have – not just for gadget-heads, but across a range of industries and enterprise use cases.

But despite the enormous potential rewards businesses can reap from IoT investment, it’s not all sunshine and rainbows. As with most things in life, IoT adoption isn’t straightforward and, as our new global CIO report, “Overcoming the Complexity of Web-Scale IoT Applications: The Top 5 Challenges”, released last week shows, CIOs still have a lot to figure out before they can tick off IoT adoption as a job well-done.
Operations and revenues at risk
Though there’s a lot of optimism going around about the benefits to be had from IoT adoption, our report shows that CIOs are also getting nervous about the negative impact IoT could have on business operations and revenues if it all comes off the rails.

These concerns are fully justified. The ecosystem behind IoT is incredibly intricate and difficult to manage. Combined with our report finding there’s a high risk of IoT strategies being rolled out without a plan in place to manage the inevitable performance issues that crop up, there could be devastating impacts for businesses that rush in unprepared.
The report also looks at:
• The ability of IT teams to meet user expectations in the IoT era
• How IoT will create new user experience headaches
• Why IoT complexity is impossible to master manually
For businesses looking to adopt IoT and benefit from all it has to offer, these findings should serve as a warning of the added complexity it will bring to the cloud ecosystem. As a result, CIOs need to make sure they are simultaneously putting plans and solutions in place to help manage IoT performance issues when they arise.

So, how do we put these concerns to rest?
The layers of complexity building up inside IoT ecosystems are increasing the challenge of managing cloud environments a thousand-fold, making the lives of IT teams harder by the minute.
It’s just not possible to overcome this type of complexity manually, so organizations need to look at monitoring and intelligence platforms that provide real-time situational awareness about what’s going on in their IoT ecosystem and cloud environment.
AI sits at the heart of these platforms, enabling businesses to automatically identify IoT service components and navigate the complex links between the applications that run on them. AI also provides software intelligence, allowing organizations to understand every users’ experience in real time. This allows IT teams to instantly analyze hugely complicated, web-scale IoT environments and stay ahead of potential performance problems – alleviating any impact on users, and more importantly, on business operations and revenue.

To see the full findings of the “Overcoming the Complexity of Web-Scale IoT Applications: The Top 5 Challenges” report, click here. CIO fears surrounding IoT are understandable, but it’s important to remember that, with the proper preparations in place, IoT is far more of a benefit than a burden.
If you want to find out how Dynatrace can help, check out this page.
The post CIOs see IoT benefits, but fear it will disrupt their IT appeared first on Dynatrace blog.
↧
↧
Dynatrace and AWS Systems Manager – Automate OneAgent distribution securely, centrally and at scale
We’re pleased to announce that Dynatrace is among the first set of partners to offer support for AWS Distributor, a capability of AWS Systems Manager, that allows you to select from available popular third party agents to install and manage.
With this launch, Dynatrace customers can now use an AWS native way to distribute OneAgent over a dynamically scaling EC2 host fleet without code. With AWS Systems Manager customers gain visibility and control of their infrastructure through a unified user interface, enabling them to automate operational tasks across their AWS resources.
We would like to thank our partners at AWS who helped make this offering available with a special thank you to our AWS Sr. Partner Solutions Architect, Shashiraj Jeripotula, who helped with the proof of concept, integration and coordination across all the various teams.
What is AWS Systems Manager Distributor?
With AWS Systems Manager Distributor, customers can install third-party packages, such as Dynatrace OneAgent. These software packages are stored in a version controlled centralized repository and made available in all supported regions for distribution by the AWS Systems Manager distributor service.
You can choose to use either Run Commands or State Manager to control the roll out of packages and versions to managed instances. Managed instances are collections of EC2 instances that can be grouped by IDs, AWS account numbers, tags, or AWS regions. This allows organizations to keep up to date with software packages and manage package versions to both Windows and Linux instances one at a time or automated schedules across groups of managed instances.
By using AWS Identity and Access Management (IAM) policies, you can control which members of your organization can create, update, deploy, and delete packages or package versions. In addition, you can audit and log Distributor user actions in their AWS accounts through integrations with other AWS services.
Leveraging Distributor, AWS and Dynatrace customers now have the confidence that their Dynatrace OneAgent packages are up to date and ready to collect all relevant monitoring data from their hosts, services and applications.
How to configure AWS distributor to install OneAgent
To install the Dynatrace OneAgent distributor package, log into the AWS console, browse to the AWS Systems Manager console and follow these steps:
1. In the navigation pane, select Distributor.
2. On the Distributor page, select Third Party and select the Dynatrace OneAgent package as shown below.

3. For this example, we’ll choose Install One Time from the options.
4. In the installation details section, pick the installation type, the package name DynatraceOneAgent, and provide the required Dynatrace specific parameters in JSON format as shown below.

5. In the targets section, there are several options as shown below. Each target options requires additional arguments such as instance tag values.

6. After selecting the option of where to save execution logs, click Run and review the Run Command distribution status. In the example below, the OneAgent was installed on 7 target hosts.

Below is an example of the distribution log detail.

If there are errors reported, the most common issue is an incorrect Dynatrace URL or TOKEN value, which will be reported in the logs.
Resources
Please visit Dynatrace’s AWS distributor documentation to get more information for installation options, parameters and troubleshooting. Also check out AWS’s Systems Manager Distributor documentation to learn more about this service.
The post Dynatrace and AWS Systems Manager – Automate OneAgent distribution securely, centrally and at scale appeared first on Dynatrace blog.
↧
A guide to Autonomous Performance Optimization
In my recent Performance Clinic with Stefano Doni, CTO & Co-Founder of Akamas, I made the statement, “Application development and release cycles today are measured in days, instead of months. Configuration options of the tech stack continue to increase in scope and complexity, with dependencies that have become unpredictable. Without automation, Performance engineers and developers can no longer ensure that applications perform as planned, and costs are minimized.”

During the Performance Clinic episode, I asked Stefano to tell us more about this changing world and how we can leverage automation, AI and machine learning to optimize modern software stacks despite the increased complexity. Stefano started his presentation by showing how much cost and performance optimization is possible when knowing how to properly configure your application runtimes, databases, or cloud environments:

Let me give you an overview of what was shown and let me answer questions we couldn’t answer during the webinar due to a technical glitch on the webinar platform!
Autonomous Performance Optimization with Akamas & Dynatrace
If you want to see a more hands-on approach, I encourage you to watch the recording as Stefano did a live demo of Akamas’s integration with Dynatrace, showing how to minimize the footprint of a Java application with automated JVM tuning.
In a nutshell, Akamas uses an AI-driven optimization approach by running multiple experiments in sequence to optimize a goal the user can set, e.g. minimize resource consumption or maximize transaction throughput. After every experiment run Akamas changes application, runtime, database or cloud configuration based on monitoring data it captured during the previous experiment run. To prove this novel approach works have a look at some of the optimization results Akamas has achieved already:

The integration with Dynatrace has two sides: first, it pulls metrics from Dynatrace while Akamas is executing an experiment. This data then flows into their AI and Machine Learning Engine to decide which configurations to change next:

Every time Akamas changes a configuration, e.g. JVM Heap Sizes, Thread Pool Sizes and so on, it also informs Dynatrace about that change so Dynatrace is aware on which changes are made to the system it is monitoring:

If you want to try this yourself make sure you watch the webinar and then head over to https://www.akamas.io/.
Webinar questions we couldn’t answer
While we made it through the webinar without a glitch, we ran into a technical issue during Q&A which is why we couldn’t answer all questions live. I sat down with Stefano to answer the incoming questions offline and now using the rest of the blog to bring those answers to you:
Q1: What type of technologies does Akamas support?
Akamas is a flexible optimization platform and optimizes many market-leading technologies thanks to its Optimization Pack library. Supported technologies include cloud services, big data, databases, OS, containers, and application runtimes like the JVM. Custom application settings can be easily optimized too, thanks to Akamas flexible AI-driven optimizer and powerful automation capabilities. A full list of currently-released Akamas Optimization Packs can be found on our website.

Q2: Can you specify certain conditions, e.g. a certain setting should be within a pre-defined range or something like which GC should be used in our JVM?
Yes! Akamas Optimization Packs already include the range of values that parameters can assume so that you don’t have to know all of them. For example, the jvm_gcType parameter already contains the list of GC types that are allowed in OpenJDK 11. You can also override the range: for example, you can say that jvm_gcType can be G1 or Parallel, and your jvm_maxHeapSize goes from 1 GB to 2 GB.
Q3: Is Akamas a SaaS offering or on-premise?
Akamas is an on-premises product and simply needs one virtual machine to get started.
Q4: Do you have a way to integrate new technology stacks to Akamas via a plugin mechanism?
Yes! Akamas comes with a library of Optimization Packs which contain all the knowledge required to optimize specific IT stacks like Java, Linux, or Docker (see answer no.1). Akamas is an open optimization platform: optimization packs for new technologies can be built very easily by the end-user, it’s just a matter of writing a few YAML files where you describe the technology parameters you want to optimize, and their ranges. Akamas AI will take them into consideration right away!
Q5: What’s the metric you pull for each experiment – is this an average across the timeframe of the experiment? or do you pull different percentiles?
Akamas integrates with many popular monitoring tools like Prometheus or Dynatrace and with load injection tools like Neoload or Loadrunner to gather performance data. Akamas gathers all the metrics that you have configured – such as average or percentiles of response times of a web application, the CPU usage of a container and more.
Akamas also enables you to automate the analysis of the experiment metrics in powerful ways. For example, our smart windowing feature can automatically identify the time window during the experiment (e.g. performance test) when the application reaches a stable throughput without violating response time constraints. The experiment score will be computed on the identified time window so that you can achieve truly reliable optimizations.

Q6: Does Akamas need to have an agent installed on each host/application? Or is it just a one-point integration with Dynatrace?
There is no Akamas agent to be installed on hosts or applications. Akamas integrates natively with monitoring and configuration management tools to gather metrics (e.g. from Dynatrace) and to apply optimized parameters (e.g. via Cloud APIs or plain simple SSH).
Automation is the key to optimizing our systems
Thanks again to Stefano Doni, CTO & Co-Founder of Akamas, for making performance optimization easier in a world that is becoming more complex every day. Tools like Akamas allow us to help our organizations deliver exceptional performance while keeping an eye on resource consumption and costs. If you’re interested in learning more feel free to reach out to us with your stories, thoughts or suggestions!
I encourage you to watch the full performance clinic – either on YouTube (below), on Dynatrace University (also includes slides download) or by registering for the On-Demand version.
The post A guide to Autonomous Performance Optimization appeared first on Dynatrace blog.
↧
Improve your cloud deployments with automated observability into your Azure Deployment Slots
As a developer, you often want to deploy different application versions to different environments, for example to differentiate between your production and staging application instances. By deploying a new version of your app into a staging environment, you can easily test it before it goes live. With Azure Deployment Slots, a feature of the Azure App Service, you can create one or more slots that can host different versions of your app. You can then easily swap these deployment slots without causing any downtime for your users.
Unlike other monitoring tools on the market, which don’t provide AI-driven anomaly detection and alerting, Dynatrace delivers real-time data to track the performance of your deployed apps and the characteristics of your client traffic. Dynatrace then alerts you to any detected performance issues. You can now simplify cloud operations with automated observability into the performance of your Azure cloud platform services in context with the performance of your applications.
- Get full visibility into your Azure Deployment Slots with one click
- Monitor and compare performance after slot swaps
- Receive alerts for any custom metric events in your Azure Deployment Slots
What are Azure Deployment Slots?
Azure Deployment Slots are available for Azure App Service and can be backed either by an App Service Web App or App Service Function App. When you deploy an app to App Service, by default it’s deployed to the production slot. If you’re running Standard, Premium, or Isolated App Service plan, you can define other slots.
A popular blue-green deployment scenario includes a staging slot in which new changes to the app are deployed and validated. You can even redirect part of your production traffic to the staging slot in order to test the new version on a limited number of real users. Once the staging version is tested and validated, it can be swapped with the production version. For full details, see the Azure documentation.
Get full visibility into your Azure Deployment Slots with one click
Once you decide to use Deployment Slots in your deployment pipeline, you need to know what the performance of the new version of the app is and whether any real user traffic has led to unexpected errors. The Dynatrace Software Intelligence Platform provides a simple one-click setup and integration for ingestion of metrics from Azure Monitor, which simplifies data consolidation.

With our new Azure Deployment Slot dashboard you get a holistic overview across all deployment slots so you can easily see at a glance how much CPU and memory your app is using in a given deployment slot. You can also track how many requests each slot serves and quickly see if there are any client- or server-side HTTP errors. Successful responses are not the only thing that matters to your clients, therefore you can also monitor response times and correlate them with the size of incoming and outgoing data. Moreover, all these metrics are also provided for each physical instance in the cluster that backs the deployment slot.
This enables cloud operations to gain actionable insights into the performance of the applications deployed in Azure Deployment Slots.
Monitor and compare performance after slot swap
The biggest advantage of using deployment slots is that you can quickly swap two slots. This comes in handy when, for example, you swap between a sprint slot (which hosts the latest version of your app) and a staging slot (which hosts the version of your app that you plan to deploy to production).
Let’s say that you redirect 5% of user traffic to a staging slot in order to ensure that it works properly with real data. Dynatrace allows you to quickly check if the new code in the staging slot works as expected.
In the screenshot below you can see that there were many more server errors (5xx) when the slots were swapped at around 14:05. Thanks to Dynatrace, you can see all this clearly aggregated on a chart and then respond accordingly. As these errors affect real users, you have two options for solving this situation:
- Redirect the 5% of traffic back to your production slot, or
- Swap the deployment slots once again to restore the previous, stable app version that was moved to the sprint slot

Receive alerts for any metric event in your Azure Deployment Slots
Dynatrace alerts you when there are too many client- or server-errors or if the response times of your app deployed in a deployment slot increase. This can be done by creating a custom event for alerting (Go to Settings > Anomaly detection > Custom events for alerting).

How to get started
Once you’ve set up the Azure Monitor integration with the Dynatrace Software Intelligence Platform, go to Settings > Cloud and virtualization > Edit Azure Subscription > Add service and search for “Azure Web App Deployment Slot.”
Add the service and you’re all set. The integration will start monitoring all non-production deployment slots in your Azure App Service.
To learn more about Azure App Service Deployment Slots monitoring, please visit our help page.
Feedback?
As always, we welcome your feedback and comments. Please share your thoughts with us either via Dynatrace Community, directly within the product through Dynatrace ONE chat, or your Dynatrace Account Manager. For additional resources for Azure monitoring, see our on-demand Power Demo, Advancing cloud Performance: Applying AI and automation to Microsoft Azure.
The post Improve your cloud deployments with automated observability into your Azure Deployment Slots appeared first on Dynatrace blog.
↧
Progressive delivery at cloud scale: Optimizing CPU intensive code with Dynatrace
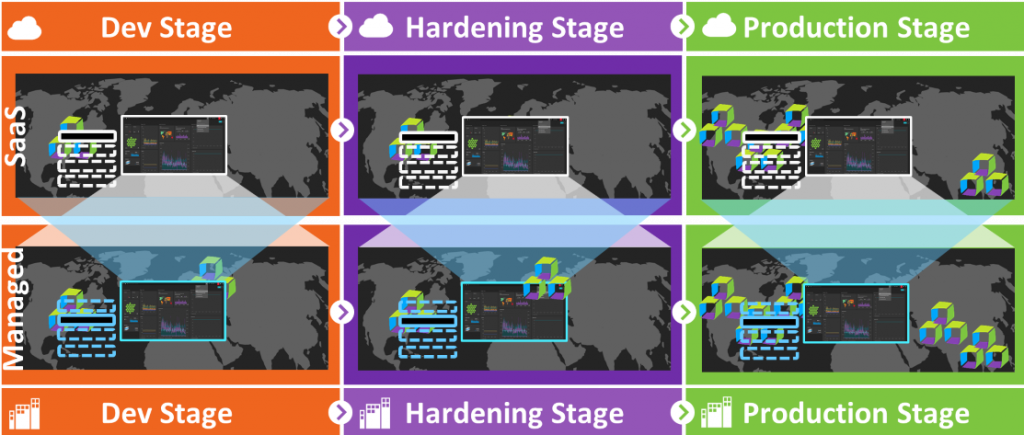
Every other week Dynatrace ships a new version of our Software Intelligence Platform into production. It’s done through what I would refer to as “Progressive Delivery at Cloud Scale”. What does that mean? The new version that comes out of our hardening stage gets rolled out to a small initial set of Dynatrace clusters. Through automated self-monitoring, we observe whether the update succeeded within a certain time window and whether the cluster runs within our defined Service Level Objectives (SLOs). If that’s the case, the update process continues to the next set of clusters and that process continues until all clusters are updated to the new version.
An individual Dynatrace cluster update is done through a rolling update of each individual cluster node. As you may know – a Dynatrace cluster always has at least 3 nodes – this is true for our Dynatrace Managed installations as well as our Dynatrace clusters that power our SaaS offering.
During such a rolling update, one node after the other is brought down, updated, and restarted. When a node comes back up, several initialization steps happen for each Dynatrace Tenant / Environment that runs on that Dynatrace Cluster. Normally, initializing such a Tenant / Environment takes about 1-2 seconds and is not a big deal, even if we have hundreds or more tenants on one node!
During one of our recent upgrades, our teams observed that a node in one of our Dynatrace SaaS clusters took much longer than normal to restart. While all other nodes took about 10 minutes to initialize ~1200 tenants, one of the nodes took about 18 minutes to initialize one specific tenant. That raised some questions: Was this an isolated issue just for one tenant or could it also come up when rolling out the version to all our other clusters that were still waiting for the new version?
As all our Dynatrace clusters – whether deployed in dev, staging, or production – are automatically self-monitored using Dynatrace, it was easy to answer this question! Our Cluster Performance Engineering Team in collaboration with our Autonomous Cloud Enablement (ACE) and development teams quickly identified the root cause and fixed the problem in no time! All thanks to the data Davis® already had ready for them when analyzing this slow startup problem.
This is a great example of how valuable Dynatrace is for diagnosing performance or scalability issues, and a great testimony that we at Dynatrace use our own product and its various capabilities across our globally distributed systems. And the code-level root cause information is what makes troubleshooting easy for developers.
Best of all – all this work was done with zero customer impact 😊
Now, let me walk you through the actual steps the team took so you can see for yourself how not only we at Dynatrace but any engineering organization can benefit from Dynatrace in any stage of the software delivery cycle:
Step 1: Dynatrace thread analysis
Dynatrace thread analysis is a great starting point to identify CPU hogging or hanging threads in your application. For our teams, the analysis immediately pointed out that the “main” thread spiked with 100% CPU utilization during the problematic startup period. You can see this yourself in the following screenshot where the “Estimated CPU time” of 59,8s / min clearly tell us that this Java main thread is fully utilizing one of our cores:
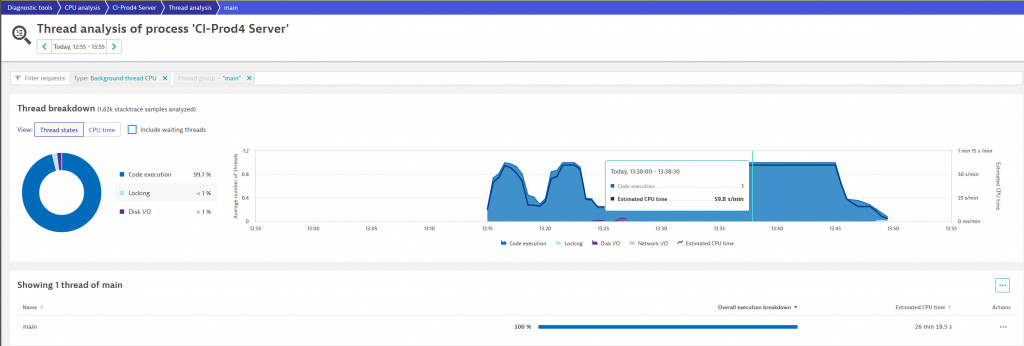
From here it’s a single click to the CPU Method Hotspot analysis!
Step 2: CPU hotspot analysis
As Dynatrace automatically captures stack traces for all threads at all time the CPU Hotspot analysis makes it easy to identify which code is consuming all that CPU in that particular thread. In our case this could be attributed to the service that initializes tenant-specific Geo-Information as you can see from the following screenshot:
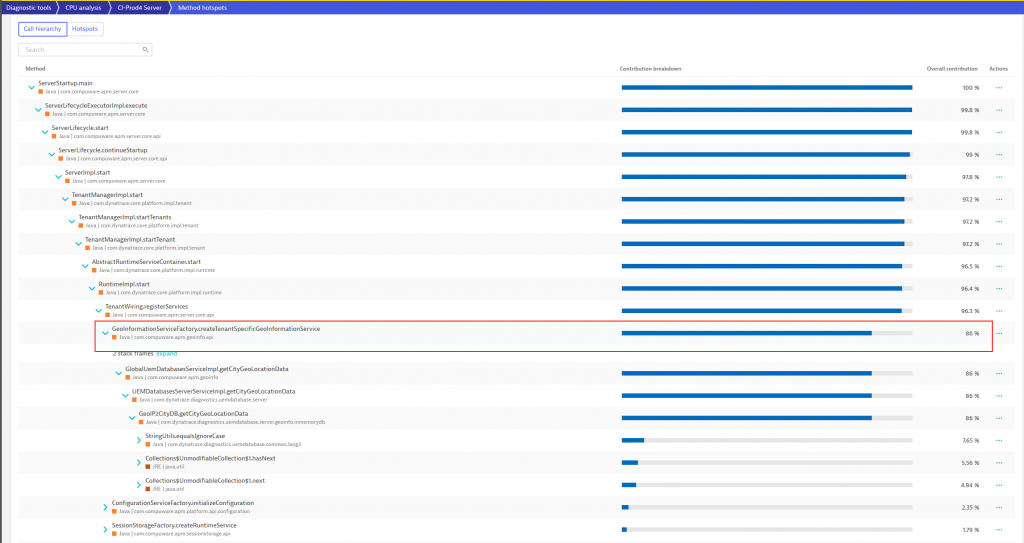
The method “hotspot view” provides many additional capabilities like decoding or downloading the byte code right here on the spot.
Step 3: Identifying root-cause in code
With Dynatrace already pointing to the problematic line of code, and the additional captured contextual information including the problematic tenant that caused this spike, it was easy to find the root cause.
It turned out that the method in question was recently added and was new in the latest rolled. The method was reading custom geographical locations for Dynatrace’s RUM geo-mapping capability and then validated against the Geographical Database Service. By default, checking these configurations is not a performance problem as a standard tenant only has a handful of these custom locations configured. The problematic tenant on that Dynatrace cluster node, however, had well over 15,000 custom locations configured, which caused the spike in CPU and long execution time as each location was checked individually against the database!
Step 4: Fixing the issue
To solve this problem several strategies were discussed. One of them being a small cache that would have brought the initial startup time down by about 95%. Another one was to rethink the whole requirement for this check during startup.
In the end, the team was able to provide a fix to this issue solving the startup time issue for this and for future updates to Dynatrace clusters.
Conclusion: Dynatrace for Developers
I’m honoured to be able to share these stories on how we use Dynatrace internally in our everyday development, performance engineering, and progressive delivery processes. It shows how Dynatrace makes life so much easier for performance engineers and developers that need to ensure our code is highly optimized for speed and resource consumption.
Special thanks to all the teams involved in bringing us this story: Cluster Performance Engineering (CPE), ACE, Development and of course our product team who is not only building great features for our customers but also features that we truly need in our own day two-day work!
The post Progressive delivery at cloud scale: Optimizing CPU intensive code with Dynatrace appeared first on Dynatrace blog.
↧
↧
How Park ‘N Fly eliminated silos and improved customer experience with Dynatrace cloud monitoring
Imagine you’re in a war room. Your ops team is seeing services that aren’t responsive, and customer complaints have started rolling in. But your infrastructure teams don’t see any issue on their AWS monitoring or Azure monitoring tools, your platform team doesn’t see anything too concerning in Kubernetes logging, and your apps team says there are green lights across the board. So, what happens next? The blame game. You think you’ve achieved observability through multiple cloud monitoring tools, but they’re fragmented, and teams are siloed, so no one has the context to identify the answers.
This scenario has become all too common as digital infrastructure has grown increasingly complex. Organizations are rapidly adopting multicloud architectures to achieve the agility needed to drive customer success through new digital service channels. Every component has its own siloed cloud monitoring tool, with its own set of data. Some looking at back-end performance – such as code execution time, CPU, or Kubernetes monitoring – and some looking at front-end performance – business KPIs, and whether apps are running well for customers. What’s missing is the context to tie it all together.
Ken Schirrmacher, Senior Director of IT for Park ‘N Fly, joined us at Perform 2021 to share how Dynatrace seamlessly connects its front-end user experience with back-end cloud monitoring, which eliminated blind spots and has allowed teams to optimize customers’ digital journeys.
Kiosks, mobile apps, websites, and QR codes
Park ‘N Fly’s business relies on successfully integrating its booking system with its custom-built kiosks located at its off-airport parking lots. “As you can imagine, it’s kind of a complex technical offering that we have”, explained Schirrmacher. “We seamlessly integrate our app, mobile, web, and kiosk experiences.
Dynatrace’s cloud monitoring capabilities support this by giving Park ‘N Fly a single source of truth into any performance changes across its technology stack in real-time. Schirrmacher gave the example of a customer driving up to a gate and trying to use their QR code to scan in. “What if there was a delay of 15 seconds?” Whilst it may not sound like a long time, fifteen seconds is an eternity when you’re rushing to get to your gate. “Dynatrace will point out the performance characteristic we can home in on, which enables us to make sure the customer experience is good.”
Seeing the smoke before the fire starts
Schirrmacher went on to explain how Dynatrace can help predict problems before they reach the customer, “How do you find out the fire’s happening? That comes from the smoke, which comes from the spark, that comes from the ember. So as you track it down through the different levels, you don’t want it to build up to where it’s a complete outage.”
By continuously monitoring its entire environment on one platform, Park ‘N Fly can identify problems as they arise at each level of the business, before they trickle down to the customer. For example, if there is a latency on a particular service, Dynatrace will flag this and trace its source – even if the source is a third party.
“Through Dynatrace, we’ve started giving our partners availability reports,” Schirrmacher explained. “We’ve hooked up synthetic monitoring, we emulated all of our calls, we had Dynatrace set to investigate those calls so we can tell when our partners are up and running and responding appropriately. We can see latency trends so we can say, ‘hey, you guys at nine o’clock at night keep having horrible latency spikes, and you’re causing a problem for our customers.’” As a result, Park ‘N Fly can work more effectively with its partners to resolve those issues.
By using Dynatrace as an all-in-one cloud monitoring platform, Park ‘N Fly has escaped the blame game with true observability across its digital infrastructure and even extended this capability to improve collaboration with third-party partners. This has enabled a more proactive and predictive company culture, where the focus is shifted from firefighting to innovation.
To learn more about how Park ‘N Fly used Dynatrace cloud monitoring to break down silos and optimize customer experiences, watch the full session using the local links below, or view the full list of Perform sessions on demand.
The post How Park ‘N Fly eliminated silos and improved customer experience with Dynatrace cloud monitoring appeared first on Dynatrace blog.
↧
Architected for resiliency: How Dynatrace withstands data center outages

Software reliability and resiliency don’t just happen by simply moving your software to a modern stack, or by moving your workloads to the cloud. There is no “Resiliency as a Service” you can connect to via an API that makes your service withstand chaotic situations. The fact is, Reliability and Resiliency must be rooted in the architecture of a distributed system. The path to “Architected for Resiliency” is long, but it clearly pays off in the long run, especially when outages occur, as I want to show you in this blog post.
This article was inspired by an email I received from Thomas Reisenbichler, Director of Autonomous Cloud Enablement on Friday, June 11th. The subject line said: “Success Story: Major Issue in single AWS Frankfurt Availability Zone!” The email walked through how our Dynatrace self-monitoring notified users of the outage but automatically remediated the problem thanks to our platform’s architecture. This meant there was no negative impact on our end-users, Service Level Objectives (SLOs), or Service Level Agreements (SLAs). And the last sentence of the email was what made me want to share this story publicly, as it’s a testimonial to how modern software engineering and operations should make you feel. It read: “Observing this issue, it was an honor to have the possibility to ‘just’ sit next to it and do a little bit of babysitting knowing that we are coping very well with this failure!”
What Thomas meant by saying this, was the dashboard showed how well the Dynatrace architecture automatically redirected traffic to the remaining nodes that were not impacted by the issue – thanks to our multi-availability zone deployment – as you can see below:

Ready to learn more? Then read on!
Fact #1: AWS EC2 outage properly documented
Let’s start with some facts. There really was an outage and AWS did a great job notifying their users about any service disruptions via their AWS Service Health Dashboard. The following screenshot shows the problem reported on June 10th for the EC2 Services in one of their Availability Zones in Frankfurt, Germany:

The problem started at 1:24PM PDT, with the services starting to become available again about 3 hours later. The final status update was at 6:54PM PDT with a very detailed description of the temperature rise that caused the shutdown initially, followed by the fire suppression system dispersing some chemicals which prolonged the full recovery process.
Fact #2: No significant impact on Dynatrace Users
There are several ways Dynatrace monitors and alerts on the impact of service disruption. Let me start with the end-user impact.
Dynatrace provides both Real User Monitoring (RUM) as well as Synthetic Monitoring as part of our Digital Experience Solution. Through the RUM data, Dynatrace’s AI engine, Davis, detected seven users were impacted by the outage when they tried to access the Web Interface. This number was so low because the automatic traffic redirect was so fast it kept the impact so low. The screenshot below shows the opened problem ticket and the root cause information:

Note to our Dynatrace users: This story triggered a feature request that will benefit every Dynatrace user in the future. The team wants to enrich root-cause information in the Dynatrace problem ticket with external or third-party status details such as the AWS Service Health Status. This will eliminate the need to cross-check whether an existing outage of your third-party providers is going on right now.
Fact #3: Minimum impact detected through synthetics
Besides real user analytics, we also use Dynatrace Synthetic Monitoring, which continuously validates successful logins to our SaaS tenants on each cluster. Those tests get executed from two locations (Paris and London) hosted by different cloud vendors (Azure & AWS).
For the outage, Dynatrace Synthetic detected a very short one-time connection timeout, as you can see below:

As a general best practice, Synthetic Tests are great to validate your core use cases are always working as expected. In our case that includes the login to our SaaS tenants and exploring captured data. If those use cases don’t work as expected, we want to get alerted.
Tip: We see more of our users started to Shift-Left and GitOps-ify Dynatrace Synthetic. This means that Synthetic Tests are not just used in production but also in pre-production environments to validate environment stability, e.g., do I have a stable build in a QA or Test environment or not? Thanks to our Automation APIs and our open-source project Monaco (Monitoring as Code) the creation and updates of those synthetic tests are fully embedded into their GitOps automation. Dynatrace Synthetic Test definitions are version control in Git, as YAML gets automatically rolled out as part of their delivery automation, e.g.: via Jenkins, GitLab, Azure DevOps, Keptn
Fact #4: Multi-node, multi-availability zone deployment architecture
I already mentioned at the beginning of this blog that resiliency and reliability do not come for free – they must be part of your architecture. And that’s true for Dynatrace as well. You can find a lot of information about the Dynatrace architecture online, both for our SaaS and Managed deployments.

I wanted to highlight a couple of essential elements that are key for Dynatrace’s resilience against a data center (=AWS Availability Zone) outage:
- High availability due to multi-AZ Dynatrace cluster node deployments
- Rack-aware Cassandra deployments
Let’s have a quick look at Dynatrace Smartscape to see how our cluster node services are truly distributed across multiple EC2 hosts in different Availability Zones:

The health-based load balancing of incoming traffic automatically redirects traffic to healthy nodes. In case of host unavailability, consumers of Dynatrace services (via Web UI or API) never experience any issues. This deployment is also super resilient to full data center (e.g., Availability Zone) outages.
As for Cassandra, a 3-node Dynatrace SaaS deployment, we deploy 9 Cassandra nodes with a rack-aware deployment. The rack is linked to the AWS Availability Zone. In case one zone goes down, the traffic gets redirected to the remaining Cassandra nodes. The following chart shows the distribution of nodes before, during, and after the outage:

The Dynatrace deployment also contains our Active Gates. But – thanks to our multi-node and multi-datacenter deployments, all these components provide the same high availability and resiliency. That’s why the complete Dynatrace Software Intelligence Platform is “Architected for Resiliency”
Tip: Our managed customers have the same high availability and resiliency features. For more information check out our documentation on fault domain awareness such as rack aware managed deployments.
Conclusion: Investing in resilient architecture is CONTINUOUS
This story proves that high availability and resiliency must be features and considerations you plan from the start when designing a distributed system. Built-in monitoring is the only way to validate these systems work as designed, and alerting is the insurance that you get notified in corner cases to reduce the risk of negative end-user impact.
I was also reminded that resilient architecture is not a “one-time investment”. It needs continuous attention and focus. At Dynatrace we built our current architecture years ago, and to ensure it still withstands challenging situations every new feature gets evaluated against non-functional requirements such as resiliency or performance. Our dynamic growth in engineering also made us invest in continuous training for new and existing hires. And to give them feedback on the potential impact of code changes we have an automated continuous performance environment that battle tests new versions before admitting them to production.
Before saying goodbye, let me say thanks to our Dynatrace Engineering and everyone involved in designing and building such a resilient system architecture. I also want to say thank you to Thomas Reisenbichler for bringing this story to my attention, to Thomas Steinmaurer for giving me additional background information, and to Giulia Di Pietro for helping me finalize the blog post.
For more on Chaos Engineering & Observability be sure to register for my upcoming webinar with Gremlin.
The post Architected for resiliency: How Dynatrace withstands data center outages appeared first on Dynatrace blog.
↧
Dynatrace extends contextual analytics and AIOps for open observability

Today’s digital businesses run on heterogeneous and highly dynamic architectures with interconnected applications and microservices deployed via Kubernetes and other cloud-native platforms. The complexity of such deployments has accelerated with the adoption of emerging, open-source technologies that generate telemetry data, which is exploding in terms of volume, speed, and cardinality. The result is that IT teams must often contend with metrics, logs, and traces that aren’t relevant to organizational business objectives—their challenge is to translate such unstructured data into actionable business insights.
With extended contextual analytics and AIOps for open observability, Dynatrace now provides you with deep insights into every entity in your IT landscape, enabling you to seamlessly integrate metrics, logs, and traces—the three pillars of observability. By adding information about dependencies between entities, Dynatrace enables seamless navigation across all data, in context, with explorative analysis of the cause-and-effect service chain. All this data is then consumed by Dynatrace Davis® AI for more precise answers, thereby driving AIOps for cloud-native environments.
Contextualization is one of the biggest challenges of observability
BizDevOps teams are looking for answers to increasingly complex questions in structured and unstructured data that’s pulled from multiple applications and external data sources. Common questions include:
- Where do bottlenecks occur in our architecture?
- How can we optimize for performance and scalability?
- Does a certain issue impact a specific service? If so, what is the root cause and suggested remediation?
Without an easy way of getting answers to such questions, enterprises risk overinvesting in operations and underinvesting in development, which slows down innovation.
Relying solely on traditional analysis methods like tagging and data correlation to answer such questions is inadequate when an IT landscape isn’t properly represented in a data model or when the cause-and-effect chain of services remains unclear. Entity tagging requires an enormous amount of manual effort and is always open to interpretation. Common tagging standards must be defined in advance and then applied consistently across the organization.
In contrast, Dynatrace doesn’t rely on standard rules for topology modeling; Dynatrace relies solely on ingested data to build topology. With this approach, resulting in data models are clear-cut representations of actual observed entities and relationships. Dynatrace also shows all data in context with visualizations that allow for slicing and dicing of monitored data across topological layers. In this way, thanks to the extensive domain knowledge that it can model, Dynatrace is able to speak in your IT department’s own internal language.
Examples of specific domain knowledge where extended topology is used include the representation of concepts like Kubernetes or serverless functions in Dynatrace. In fact, we are so convinced of the value of extending the topology and effectiveness of this way of working that we use it ourselves at Dynatrace to build new functionality.
Dynatrace extends its unique topology-based analytics and AIOps approach
Dynatrace offers a unique approach to analytics and AI-powered insights. Our platform uses extensible real-time topology and AI to put data into an actionable context, enabling AIOps of cloud-native architectures at scale.
To achieve this, Dynatrace uniquely creates a data model that represents all detected software components and their interdependencies. Smartscape®, our topology-mapping technology, is available out-of-the-box for more than 560 technologies, enabling seamless navigation and analysis.
Extend your topology mapping to include open-source observability data
With these new capabilities, business-specific components of cloud-native ecosystems can be added to your automatically generated data model and provide structure for actionable insights into open-source observability data. For example, you may need to model physical locations of shops or branch offices due to reporting requirements. Such business requirements, or other customer-specific domain knowledge, can be used to extend Dynatrace Smartscape®. Operations teams can leverage the same approach to improve analytics and insights into data storage, network devices, or even the room temperatures of specific server rooms.
Based on such data models, Dynatrace now provides a unified analysis, which brings together all relevant information across metrics, events, logs, and traces for each component in your IT landscape, enabling advanced analysis of the data and an intuitive, relationship-aware navigation and analytics workflow.
This additional context further fuels Davis, the Dynatrace AI engine, for more precise automatic answers to application and infrastructure questions, as well as for addressing potential SLO violations before they occur. As Davis provides deterministic and explainable AI based on such a sophisticated data model, it enables AIOps for large-scale cloud-native environments.
Next steps
All Dynatrace enhancements mentioned in this blog post will be available within the next 90 days.
- If you are a Dynatrace customer and want to start using the new extended topology, please navigate to the Hub to see which technologies we support.
- If you’re not using Dynatrace yet, it’s easy to get started in under 5 minutes with the Dynatrace free trial.
For more information visit our webpage.
The post Dynatrace extends contextual analytics and AIOps for open observability appeared first on Dynatrace blog.
↧
What’s the hype with hyperscale?
As we adapted to the changing environment and customer expectations the last year brought, we have evolved into a “new normal” that is increasingly digital in the way we interact with businesses. This isn’t limited to consumers; employees also find themselves empowered by digital and the ability to work from anywhere.
The digital future that’s on the horizon is reliant on the power of the cloud and will require the best technology to match. But what does that look like? More recently, there has been a lot of talk about hyperscale and hyperscalers, but what exactly is “hyperscale”?
What is hyperscale?
Hyperscale is the ability of an architecture to scale appropriately as increased demand is added to the system. Hyperscalers are often organizations that provide seamless delivery to build a robust and scalable cloud. Some examples include AWS, Microsoft, and Google.
Hyperscale is important because it provides the ability to scale and respond immediately to increased demand, as well as being easily accessible, cost-effective, and reliable. Here’s a list of some key hyperscale benefits:
- Speed: Hyperscale makes it easy to manage your shifting computing needs.
- Reduce downtime: Hyperscale reduces the cost of disruption, minimizing downtime due to increased demand or other issues.
- Increase operational efficiency: Hyperscale reduces the layers of control, making it easier to manage modern computer operations.
- Digital transformation: Hyperscale makes it easy to transition and/or grow in the cloud.
- Scale: Hyperscale allows you to scale up or down depending on demand.
Hyperscale and your business
So, what does hyperscale mean for businesses? As mentioned above, the way we rely on digital is not going away and transformation goals are not yet complete. Organizations, and teams within them, need to stay the course, leveraging multicloud platforms to meet the demand of users proactively and proficiently, as well as drive business growth. Hyperscale and partnering with a hyperscaler are key to keeping these platforms up and running and eliminating disruption, whether it be to a consumer’s digital shopping experience or your remote workers dialing in and collaborating from different regions of the world. Leveraging this will enable organizations to meet the demands and apply the appropriate resources.
Does this mean with hyperscale everything is perfect? No. With all these transitions, challenges will arise due to the increasing complexity of these dynamic environments. That’s why it’s important to find ways to automate the influx of data hyperscalers bring.
Automatic and intelligent observability for hyperscale
Understanding multicloud environments requires automation because it can handle the scale of every single component in an enterprise ecosystem as well as the interdependencies. This alleviates manual tasks and allows the focus on driving substantial business results.
Dynatrace delivers automatic and intelligent observability at scale for cloud-native workloads and enterprise applications to help ensure end-to-end multicloud distributed tracing. This helps you transform faster by taming modern cloud complexity with observability, automation, and intelligence in a single platform delivering multicloud observability that’s more than metrics, logs, and traces. Dynatrace is a partner with the hyperscalers you use most, with deep innovative integrations with AWS, Azure, Google, and many more.
Start a free trial!
Download Dynatrace’s free trial to see how easy it is to get out-of-the-box support for hyperscale cloud.
The post What’s the hype with hyperscale? appeared first on Dynatrace blog.
↧
↧
Dynatrace Announces Management Zones to Tackle Dynamic Multi-Cloud Software Challenges
The post Dynatrace Announces Management Zones to Tackle Dynamic Multi-Cloud Software Challenges appeared first on Dynatrace blog.
↧
Why log monitoring and log analytics matter in a hyperscale world

Log monitoring, log analysis, and log analytics are more important than ever as organizations adopt more cloud-native technologies, containers, and microservices-based architectures.
In fact, the global log management market is expected to grow from 1.9 billion in 2020 to $4.1 billion by 2026 according to numerous market research reports. Driving this growth is the increasing adoption of hyperscale cloud providers (AWS, Azure, and GCP) and containerized microservices running on Kubernetes. The flexibility of these environments also makes them more complex, and brings an exponential increase in the volume, velocity, and variety of logs. To figure out what’s going on in these increasingly complex environments—and more importantly, to harness their operational and business value—teams need a smarter way to monitor and analyze logs.
Let’s take a closer look at logs, log monitoring, and log analytics to understand what they are and why they are so critical for establishing and maintaining a healthy modern cloud architecture.
What are logs?
A log is a detailed, timestamped record of an event generated by an operating system, computing environment, application, server, or network device. Logs can include data about user inputs, system processes, and hardware states.
Log files contain much of the data that makes a system observable: for example, records of all events that occur throughout the operating system, network devices, pieces of software, or even communication between users and application systems. “Logging” is the practice of generating and storing logs for later analysis.
What is log monitoring?
Log monitoring is a process by which developers and administrators continuously observe logs as they’re being recorded. With the help of log monitoring software, teams can collect information and trigger alerts if something happens that affects system performance and health.
DevOps teams often use a log monitoring solution to ingest application, service, and system logs so they can detect issues at any phase of the software delivery life cycle (SDLC). Whether a situation arises during development, testing, deployment, or in production, it’s important to work with a solution that can detect conditions in real-time so teams can troubleshoot issues before they slow down development or impact customers.
But to determine root causes, logs must be analyzed.
What is log analytics?
Log analytics is the process of evaluating and interpreting log data so teams can quickly detect and resolve issues. For example, an error message or application alert can indicate something went wrong, but it requires investigation into the logs to understand exactly what happened where, when, and with what outcome so teams can take appropriate action. This analysis is useful for routine application performance monitoring, and also for CI/CD feedback loops, optimizing Kubernetes workloads, application security, business analytics and standards compliance to name just a few.
You can think of log analytics as a science that seeks to make sense of system and application-generated information. However, the process of log analysis can become complicated without the proper tools.
Log monitoring vs log analytics
Log monitoring and log analytics are related but different concepts that work in conjunction to ensure the health and optimal operation of applications and core services.
Whereas log monitoring is the process of tracking ingested and recorded logs, log analytics evaluates those logs and their context for the significance of the events they represent. This includes troubleshooting issues with software, services, and applications, and any infrastructure they interact with, such as multicloud platforms, container environments, and data repositories.
Log monitoring and analytics work in conjunction to ensure an application is performing as it should be, and to determine how a system could be improved.
Log analytics also help identify ways to make infrastructure environments more predictable, efficient, and resilient. Together, they provide continuous value to the business.
Benefits of log monitoring and log analytics
Log monitoring and analytics help teams to maintain situational awareness in cloud-native environments. Here are some benefits these practices provide:
- Faster incident response and resolution. Log monitoring and analysis helps teams respond to incidents faster and discover issues earlier before they affect end users.
- More automation. With clear insight into crucial system metrics, teams can automate more processes and responses with greater precision.
- Optimized system performance. Log analysis can reveal potential bottlenecks and inefficient configurations so teams can fine-tune system performance.
- Increased collaboration. A single source of high-fidelity log analytics benefits system administrators, cloud architects, and operations teams so they can create more resilient multicloud environments.
- Accelerated innovation. An efficient, automated log monitoring and analytics solution can free teams up to focus on innovation that drives better business outcomes.
Use cases for log monitoring and log analytics
Anything connected to a network that generates a log of activity is a candidate for log monitoring and analysis. As solutions have evolved to leverage artificial intelligence, the variety of use cases has extended beyond break-fix scenarios to address a wide range of technology and business concerns. For example:
- Infrastructure monitoring to automatically track modern cloud infrastructure, including hosts, VMs, PaaS such as AWS, Azure, GCP, container platforms such as Kubernetes, OpenShift, and Cloud Foundry, network devices, process detection and resource utilization, network usage and performance, log monitoring, third-party data and event integration, and so on
- Applications and microservices performance monitoring to discover dynamic microservices workloads running inside containers, and to detect and pinpoint issues before real users are impacted
- Digital experience monitoring including real-user monitoring, synthetic monitoring, and mobile app monitoring to ensure every application is available, responsive, fast, and efficient across every channel
- Application security to automatically detect vulnerabilities across cloud and Kubernetes environments
- Business analytics for real-time visibility into business KPIs to improve IT and business collaboration
- Cloud automation/orchestration for DevOps and SRE teams to build better quality software faster by bringing observability, automation and intelligence to DevOps pipelines
In modern environments, turning the crush of incoming logs and data into meaningful use cases can quickly become overwhelming. Let’s look at some challenges behind log monitoring and log analysis and what organizations are doing to overcome these issues.
Challenges to monitoring and log analytics
While log monitoring and analysis are an essential part of IT operations, practicing them effectively in cloud-native environments has some challenges.
For example:
- Lack of end-to-end observability. Observability means being able to measure an individual system’s current state based on the data it generates. As environments become bigger and more complex, observability across the full technology stack (thousands of interdependent microservices spread across multiple clouds) becomes increasingly difficult.
- Inadequate context. Logs are often collected in data silos, with no relationships between them and aggregated in meaningless ways. Without meaningful relationships between the silos, you’re often looking for a few traces among billions to know whether two alerts are related or how users may be impacted by them.
- Guessing at the root cause. Too often, logging tools leave you clicking through data and poring through logs trying to deduce root causes based on simple correlations. Lack of causation makes it difficult to quantify impact to users or determine which optimization efforts are delivering performance improvements.
- Difficulty understanding the business impacts. Because digital systems underpin every modern organization, log analysis has the potential to unlock critical insights to help with making data-driven business decisions. However, most log analytics tools lack sufficient observability, context, and precision to reveal how applications, services, or development processes are impacting the business.
- High cost and blind spots. To avoid the high data-ingest costs of traditional log monitoring solutions, many organizations exclude large portions of their logs and perform minimal sampling. Although cold storage and rehydration can mitigate high costs, it is inefficient and creates blind spots.
With the complexity of modern multicloud environments, traditional aggregation and correlation approaches are inadequate to quickly discover faulty code, anomalies, and vulnerabilities. And too often, organizations have implemented multiple disparate tools to address different problems at different phases, which only compounds the complexity.
How Dynatrace unlocks the value of log monitoring and analytics
Logs are an essential part of the three fundamental pillars of observability: metrics, logs, and traces. End-to-end observability is crucial for gaining situational awareness into cloud-native architectures. But logs alone aren’t enough. To attain true observability, organizations need the ability to determine the context of an issue, both upstream and downstream. Equally important is leveraging user experience data to understand what’s affected, what the root cause is, and how it impacts the business.
To overcome these challenges and to get the best intelligence for log monitoring and analytics, organizations need to work with a solution that takes analytics to the next level.
Using a real-time map of the software topology and deterministic AI, Dynatrace helps DevOps teams automatically monitor and analyze all logs in context of their upstream and downstream dependencies. This broad yet granular visibility enables analysts to understand the business context of an issue and automatically pinpoint its precise root cause down to a particular line of code.
Unlike tools that rely on correlation and aggregation, the Dynatrace AIOps platform approach enables teams to speed up and automate incident responses. As a single source of truth, Dynatrace’s combination of precise answers and automation frees up teams to optimize apps and processes, improve system reliability, and drive better business outcomes.
To learn more about how Dynatrace can turn your organization’s logs into critical insights, join us for the on-demand power demo “Observe all your logs in context with Dynatrace log monitoring.”
The post Why log monitoring and log analytics matter in a hyperscale world appeared first on Dynatrace blog.
↧
If Data Was A Football Team
The post If Data Was A Football Team appeared first on Dynatrace blog.
↧